MDM4U Unit 1:
Statistical Analysis
1-1 Sampling Techniques and Bias in Surveys
Learning Goal:
I am able to ...
- understand the difference between sampling techniques; and
- recognize bias in survey questions, and create questions that limit bias.
Lesson:
- Read pages 113-116 in the textbook.
- Define the following terms, and write an example to illustrate the difference between them:
- Population
- Sample
- Copy and complete the following table:
Sampling Technique |
Definition |
Example |
simple random sample |
||
systematic sample |
||
stratified sample |
||
cluster sample |
||
multi-stage sample |
||
voluntary-response sample |
||
convenience sample |
- Read pages 119-122 in the textbook.
- Copy the following sentence into your notes:
- "Statistical bias is any factor that favours certain outcomes or responses and hence systematically skews the survey results."
- Copy and complete the following table:
Type of Bias |
Definition |
Example |
sampling bias |
||
non-response bias |
||
measurement bias |
||
response bias |
Work:
Complete the following questions, and show them to Mr Fisher.
- Page 117 #1-3
- Page 117 #4-12 (choose your favourite three)
- Page 123 #1-3, 6, 8
Assignment:
- Open up this online textbook (Collaborative Statistics).
- From section 1.6 Sampling - on pg. 28 (or 36 of the pdf)
- read Example 1.6 and 1.7
- Complete 1.14 Lab 2 - Sampling Experiment (pg. 52, pdf 62)
- You may complete the lab alone or with one partner.
- Here is a link to a 'true' random number generator that you can use.
- Prepare an electronic version of the lab to be shared with me ([email protected])
1-2 Measures of Central Tendency
Learning Goal:
I am able to ...
- explain and calculate all measures of central tendency when given raw data.
Lesson:
Watch and take notes from the following videos.
- Refer to the Key Equations page (last page in your textbook) for all formulas.
- Make a copy of the Google Sheets file used in the video examples (ignore the stuff he says about Google Classroom).
|
|
|
|
Note: Ignore the "Homework" assigned at the end of the video.
Work:
Complete the following questions, and show them to Mr Fisher.
- Page 133 #1-5, 7-9, 11, 12 (don't do 12e)
1-3 Measures of Spread
Learning Goal:
I am able to ...
- calculate a measure of spread for a given set of data.
Lesson:
Watch and take notes from the following videos.
- Refer to the Key Equations page (last page in your textbook) for all formulas.
- Make a copy of the Google Sheets file used in the video examples (ignore the stuff he says about Google Classroom).
|
|
|
|
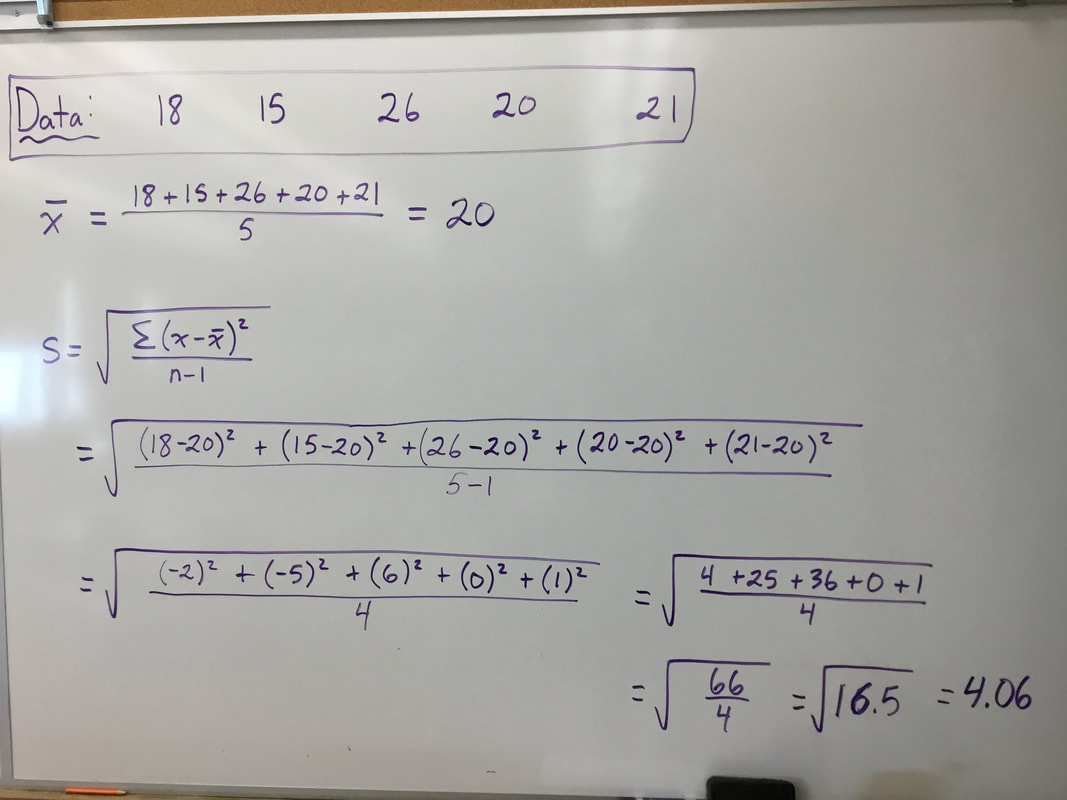
Here's a worked example for calculating standard deviation:
Work:
Complete the following questions, and show them to Mr Fisher.
- Page 148 #1-7, 9, 10
1-4 Visual Displays of Data
Learning Goal:
I am able to ...
- structure and organize data to allow the use of a spreadsheet to create a graphical display for the data.
Lesson:
Watch and take notes from the following videos.
- Make a copy of the Google Sheets file used in the video examples (ignore the stuff he says about Google Classroom).
|
|
|
|
Note: Ignore the "Homework" assigned at the end of the video
Work:
Complete the following questions, and show them to Mr Fisher.
- Page 101 #1-3, 5, 8-9
1-5 Scatter plots and Linear Correlation
Learning Goal:
I am able to ...
- critically assess a scatter plot; and
- determine the type of relationship, specifically linear correlations.
Lesson:
Watch and take notes from the following videos.
- Refer to the Key Equations page (last page in your textbook) for all formulas.
- Make a copy of the Google Sheets file used in the video examples.
|
|
|
|
Note: Ignore the "Homework" assigned at the end of the video
Work:
Complete the following questions, and show them to Mr Fisher.
- Page 168 #1-6, 10
For Your Interest:
Here are some videos describing how data collected through social media can be used to predict a lot of things about people through the power of correlation. Very interesting!
1-6 Linear Regression
Learning Goal:
I can ...
- use technology to obtain an algebraic model for a set of data using the concept of linear regression.
Lesson:
Watch and take notes from the following videos.
- Make a copy of the Google Sheets file used in the video examples.
|
|
|
Note: Ignore the "Homework" assigned at the end of the video
Work:
Complete the following questions, and show them to Mr Fisher.
- Page 180 #1, 2, 5-7, 13
1-7 Non-Linear Regression
Learning Goal:
I can ...
- identify non-linear correlations in data; and
- use technology to determine an algebraic model using the concept of regression.
Lesson:
Watch and take notes from the following videos.
- Make a copy of the Google Sheets file used in the video examples.
|
|
|
Note: Ignore the "Homework" assigned at the end of the video
Work:
Complete the following questions, and show them to Mr Fisher.
- Page 191 #1-5
- Polynomial Modelling, #1, 3, 5
1-8 Applications of Regression and Critical Analysis
Learning Goal:
I can ...
- apply regression to real-world situations; and
- analyze the resulting regression, drawing appropriate conclusions and recommendations.
Lesson:
Watch and take notes from the following videos.
- Make a copy of the Google Sheets file used in the video examples.
|
|
|
|
Note: Ignore the "Homework" assigned at the end of the video
Work:
Complete the following questions, and show them to Mr Fisher.
- Page 209 #3-6, 8
Unit 1 Assignments
There are two major assignments to complete for this unit. For each assignment, you will need to create a report in Google Docs and share it with Mr Fisher ([email protected])
- Assignment 1: Correlation vs. Causation
- Assignment 2: Regression Analysis
Unit 1 Review
Complete the following questions in order to prepare for the Unit 1 Test. Remember to check your answers to make sure you understand.
- Unit 1 Review (answers included)
Unit 1 Test
When you are ready for the Unit 1 Test, ask Mr Fisher for it.
You will need a full period to complete the test.
You will need a full period to complete the test.
